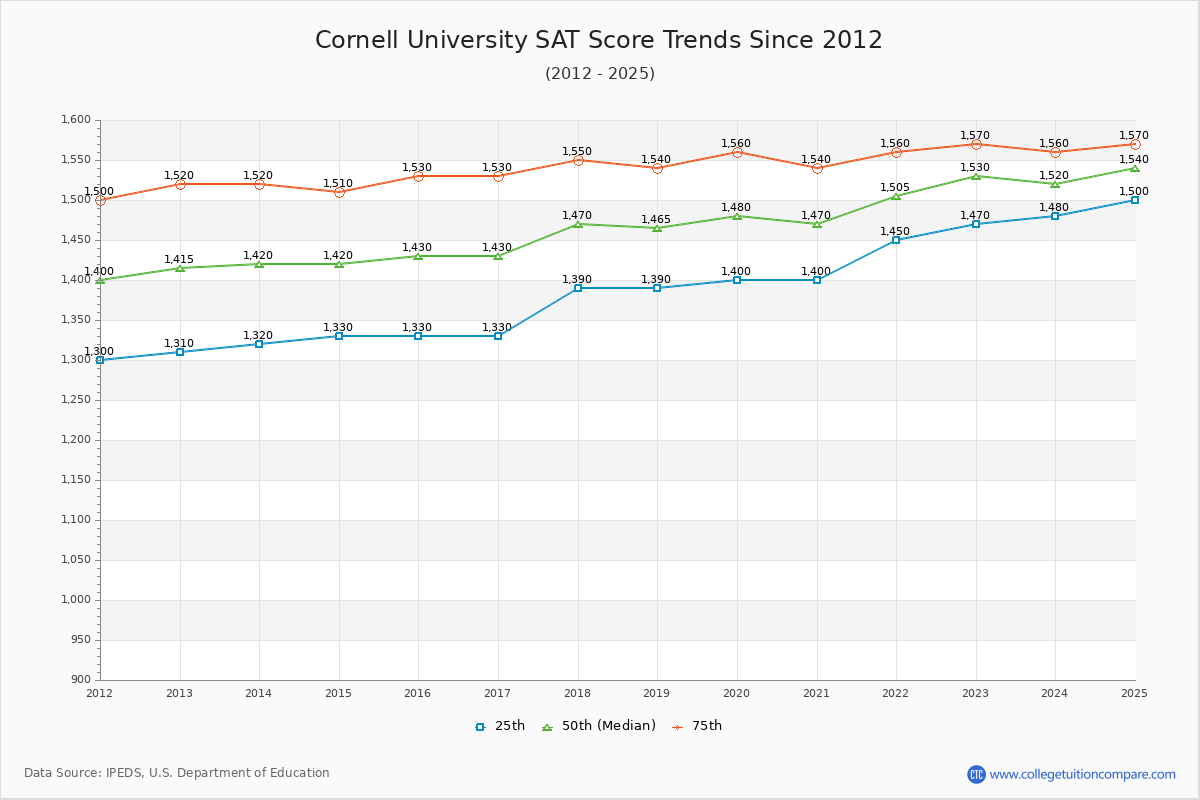
The SAT score have been increased 100 points since 2013 and the SAT score went up and down almost every year at Cornell. Compared to previous year, the SAT score decreased by 10 points at Cornell. Compared to similar schools, the submitted SAT and ACT scores are extremely competitive and high at Cornell.
You can check and compare colleges with similar SAT scores Cornell by SAT score range 1420-1520 and 1470-1570.
The 2024 SAT score is 1520 at Cornell. Over the past 12 years, the average SAT score is 1390 (25 th percentile) and 1543 (75 th percentile). Compared to similar schools, the submitted SAT scores are extremely competitive and high at Cornell.
The following table and chart illustrate the changes in SAT scores at Cornell University since 2013.
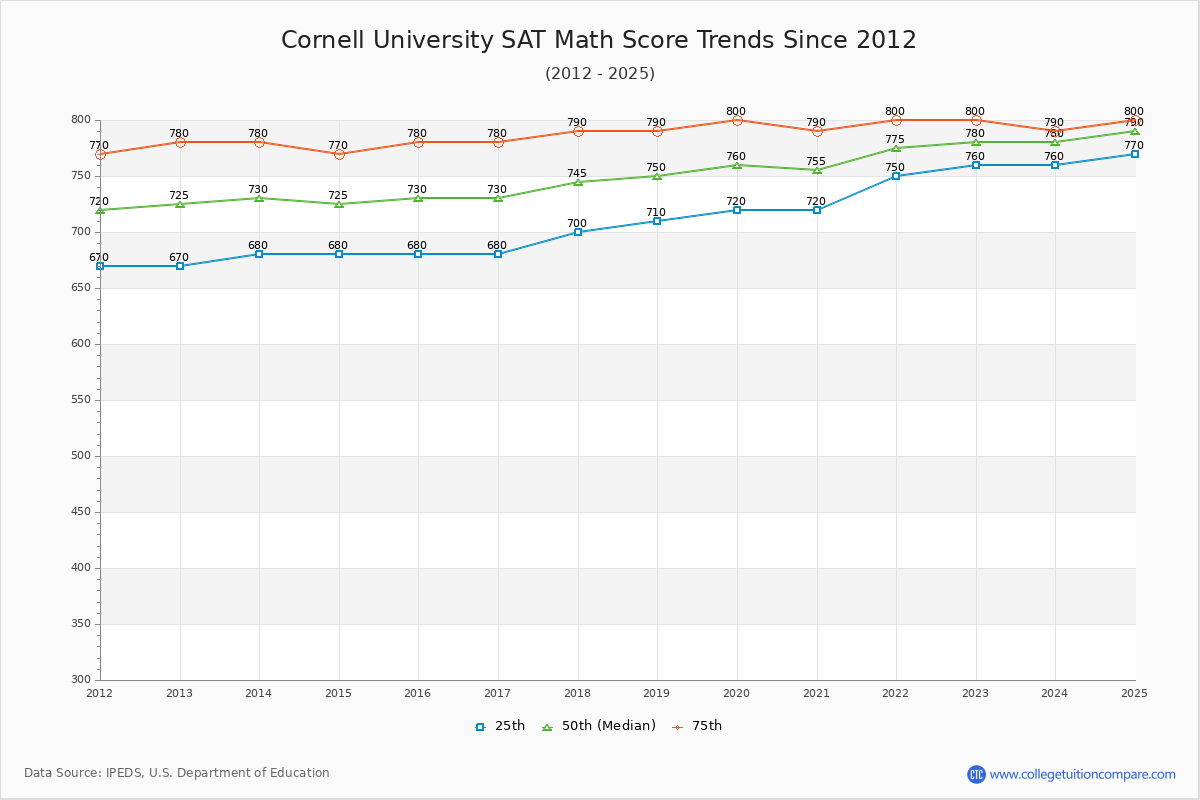
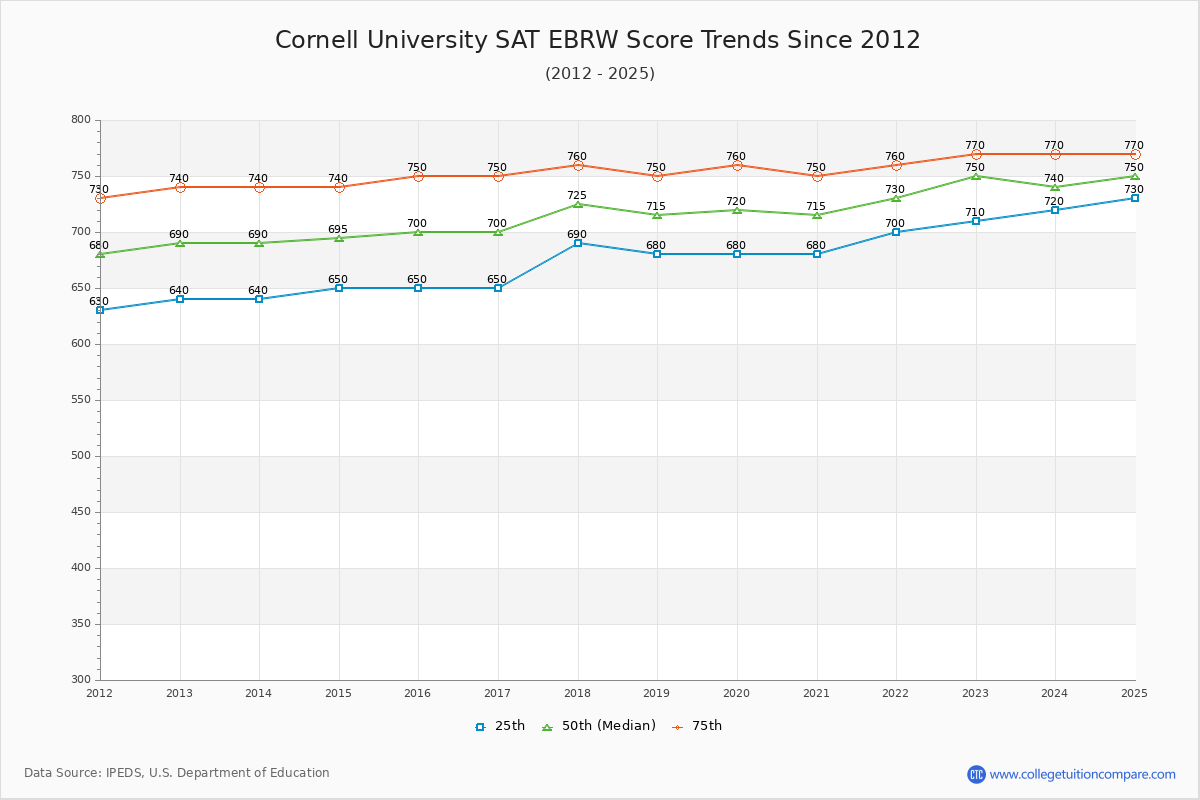
| Year | Total | Math | Evidence-Based Reading and Writing | ||||||
|---|---|---|---|---|---|---|---|---|---|
| 25 th | 50 th | 75 th | 25 th | 50 th | 75 th | 25 th | 50 th | 75 th | |
| 2013-14 | 1,320 | 1,420 | 1,520 | 680 | 730 | 780 | 640 | 690 | 740 |
| 2014-15 | 1,330 | 1,420 | 1,510 | 680 | 725 | 770 | 650 | 695 | 740 |
| 2015-16 | 1,330 | 1,430 | 1,530 | 680 | 730 | 780 | 650 | 700 | 750 |
| 2016-17 | 1,330 | 1,430 | 1,530 | 680 | 730 | 780 | 650 | 700 | 750 |
| 2017-18 | 1,390 | 1,470 | 1,550 | 700 | 745 | 790 | 690 | 725 | 760 |
| 2018-19 | 1,390 | 1,465 | 1,540 | 710 | 750 | 790 | 680 | 715 | 750 |
| 2019-20 | 1,400 | 1,480 | 1,560 | 720 | 760 | 800 | 680 | 720 | 760 |
| 2020-21 | 1,400 | 1,470 | 1,540 | 720 | 755 | 790 | 680 | 715 | 750 |
| 2021-22 | 1,450 | 1,505 | 1,560 | 750 | 775 | 800 | 700 | 730 | 760 |
| 2022-23 | 1,470 | 1,530 | 1,570 | 760 | 780 | 800 | 710 | 750 | 770 |
| 2023-24 | 1,480 | 1,520 | 1,560 | 760 | 780 | 790 | 720 | 740 | 770 |
| Average | 1390 | 1467 | 1543 | 713 | 751 | 788 | 677 | 716 | 755 |
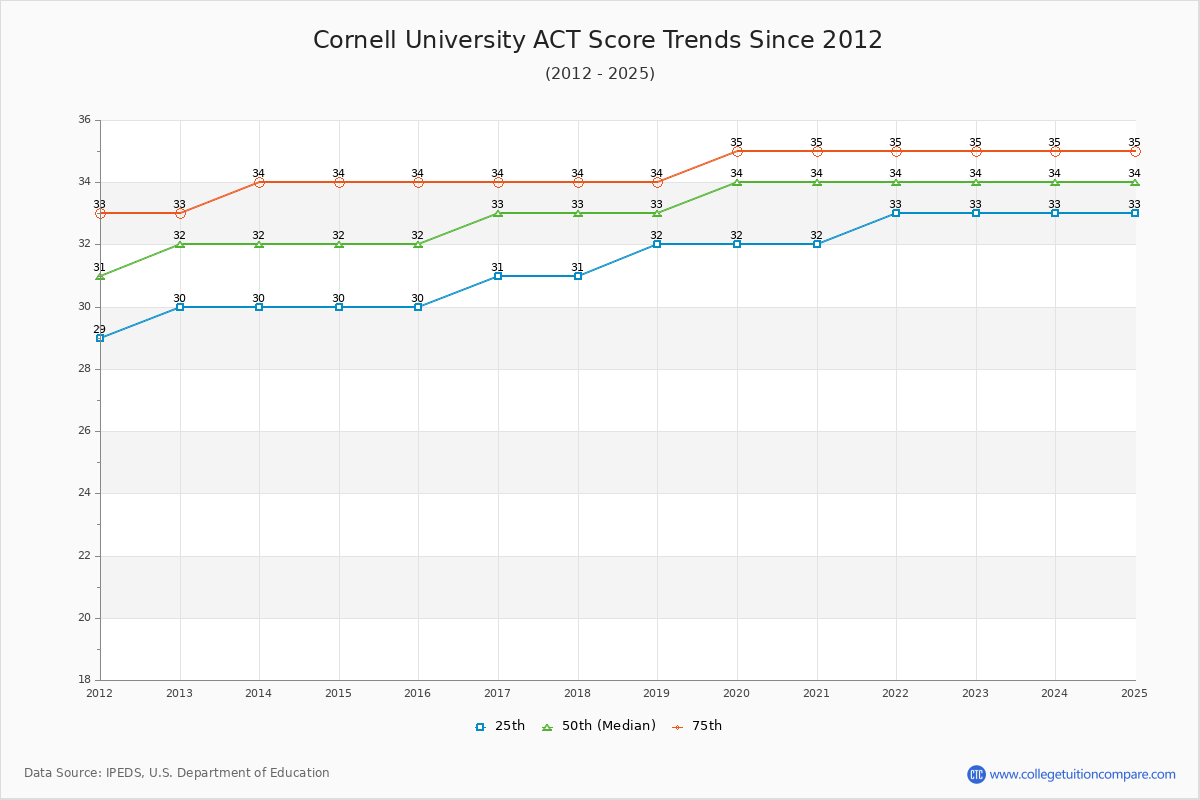
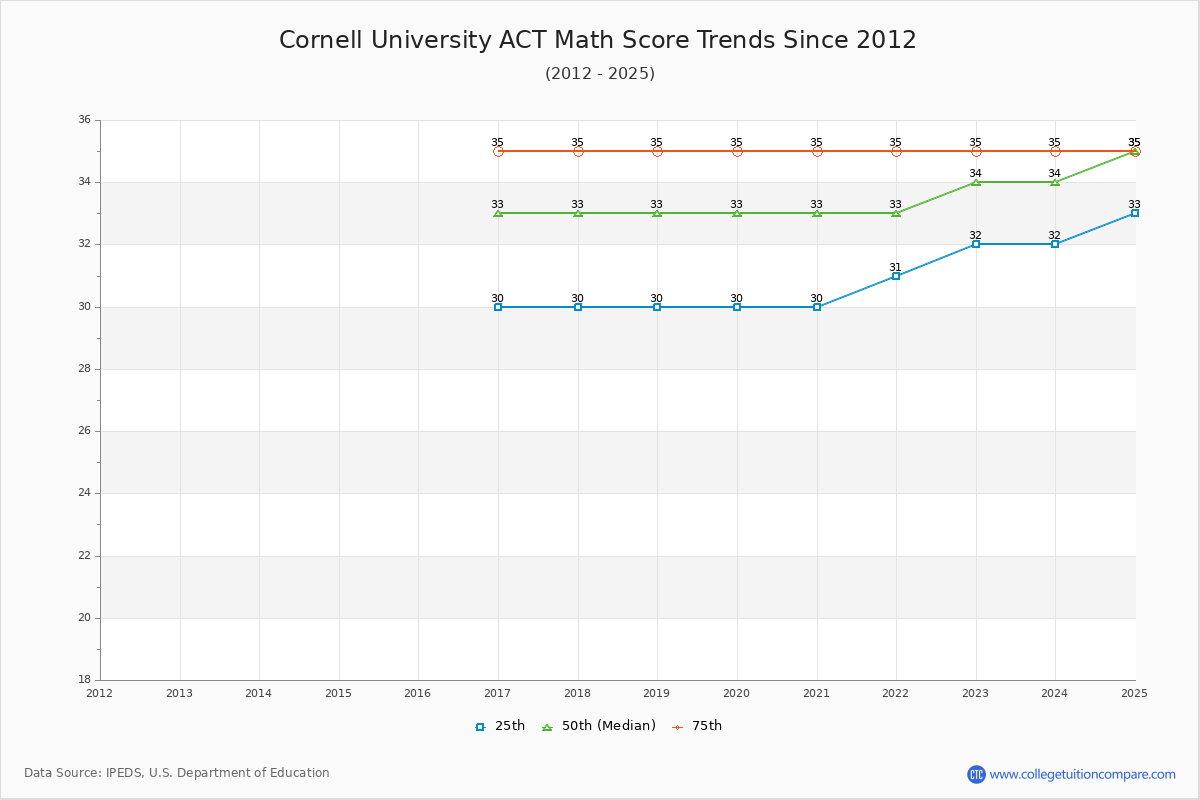
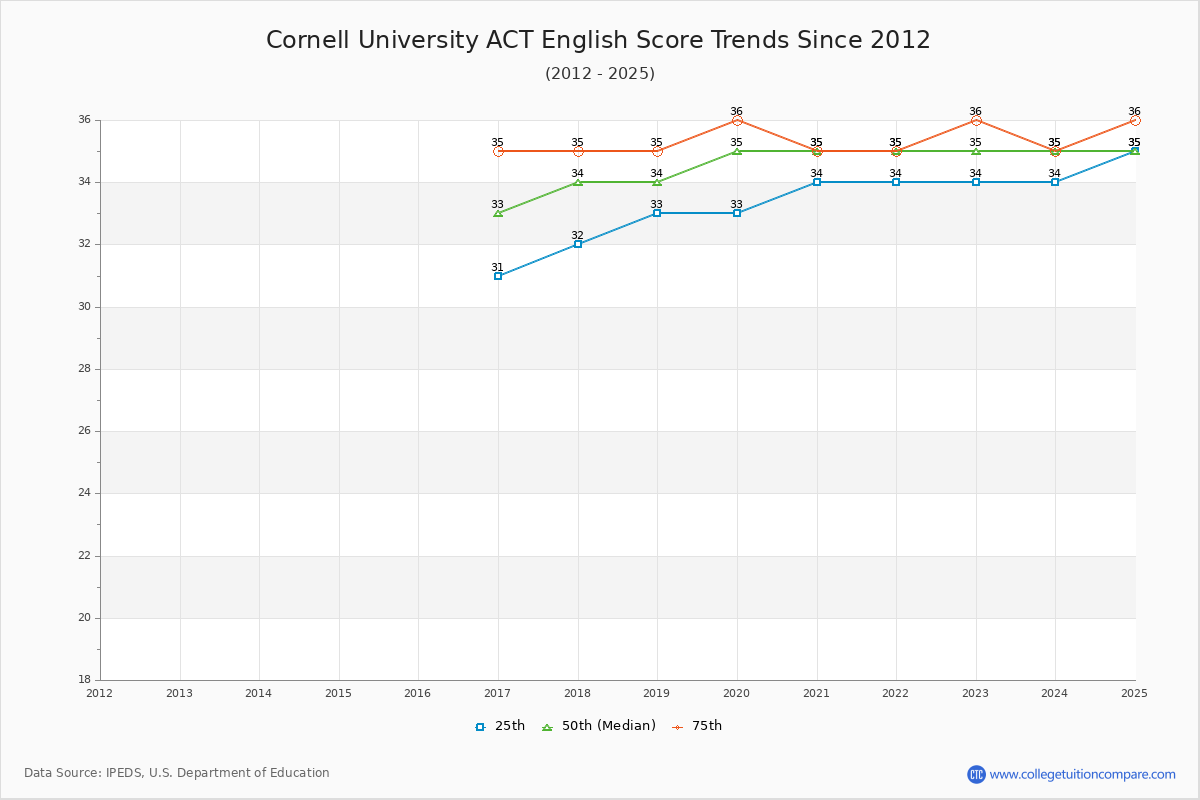
The 2024 ACT score is 34 at Cornell. Over the past 12 years, the average ACT score of the last 12 years is 32 (25 th percentile) and 34 (75 th percentile). Compared to similar schools, the submitted ACT scores are extremely competitive and high at Cornell.
The following table and chart show the changes in ACT scores at Cornell University since 2013.
| Year | Composite | English | Math | ||||||
|---|---|---|---|---|---|---|---|---|---|
| 25 th | 50 th | 75 th | 25 th | 50 th | 75 th | 25 th | 50 th | 75 th | |
| 2013-14 | 30 | 32 | 34 | - | - | - | - | - | - |
| 2014-15 | 30 | 32 | 34 | - | - | - | - | - | - |
| 2015-16 | 30 | 32 | 34 | - | - | - | - | - | - |
| 2016-17 | 31 | 33 | 34 | 31 | 33 | 35 | 30 | 33 | 35 |
| 2017-18 | 31 | 33 | 34 | 32 | 34 | 35 | 30 | 33 | 35 |
| 2018-19 | 32 | 33 | 34 | 33 | 34 | 35 | 30 | 33 | 35 |
| 2019-20 | 32 | 34 | 35 | 33 | 35 | 36 | 30 | 33 | 35 |
| 2020-21 | 32 | 34 | 35 | 34 | 35 | 35 | 30 | 33 | 35 |
| 2021-22 | 33 | 34 | 35 | 34 | 35 | 35 | 31 | 33 | 35 |
| 2022-23 | 33 | 34 | 35 | 34 | 35 | 36 | 32 | 34 | 35 |
| 2023-24 | 33 | 34 | 35 | 34 | 35 | 35 | 32 | 34 | 35 |
| Average | 32 | 33 | 34 | 33 | 34 | 35 | 31 | 33 | 35 |
The following table compares SAT score changes from last year between Cornell University and similar schools.
| 2024 | 2023 | Change % | |
|---|---|---|---|
| Cornell University | 1530 | 1505 | 1.66% |
| Yale University | 1540 | 1530 | 0.65% |
| Princeton University | 1540 | 1515 | 1.65% |
| Harvard University | 1550 | 1530 | 1.31% |
| University of Pennsylvania | 1540 | 1525 | 0.98% |
| Columbia University in the City of New York | 1530 | 1520 | 0.66% |
Share your experiences and thoughts about Cornell University. It will be a great help to applicants and prospective students!